
 SMMT Website


 my details
 Company Details
 Logout


Cars
- Vehicle Data

- Registrations
- Cars
Lorem ipsum dolor sit amet, consectetur
| marque | 2023 | % Market share | 2022 | % Market share | % change |
|---|---|---|---|---|---|
|
abarth |
153,529 |
0.11 |
153,529 |
0.11 |
-45.79 |
|
alfa romeo |
153,529 |
0.11 |
153,529 |
0.11 |
-45.79 |
|
alpine |
153,529 |
0.11 |
153,529 |
0.11 |
-45.79 |
|
bentley |
153,529 |
0.11 |
153,529 |
0.11 |
-45.79 |
|
bmw |
153,529 |
0.11 |
153,529 |
0.11 |
-45.79 |
|
byd |
153,529 |
0.11 |
153,529 |
0.11 |
-45.79 |
|
citroen |
153,529 |
0.11 |
153,529 |
0.11 |
-45.79 |
|
two line |
153,529 |
0.11 |
153,529 |
0.11 |
-45.79 |
| total | 1,605,437 | 1,605,437 | 19.57 |
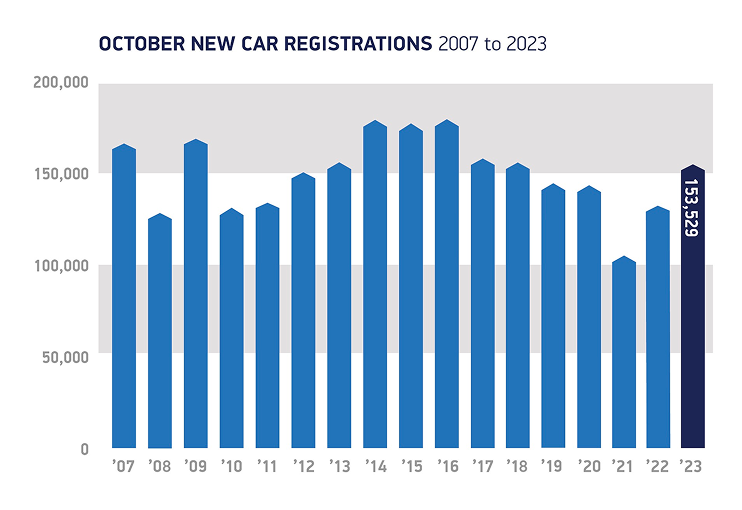
annual new car registrations
Best Sellers
| october 2023 | year-to-date |
|---|---|
|
01 ford puma 4,824 |
01 ford puma 100,000 |
|
02 mini 100,000 |
02 nissan qashqai 4,824 |
|
03 vauxhall corsa 4,824 |
03 vauxhall corsa 100,000 |
|
04 volkswagen polo 100,000 |
04 kia sportage 4,824 |
|
05 bmw 1 series 4,824 |
05 tesla model y 100,000 |
|
06 kia sportage 100,000 |
06 hyundai tucso 4,824 |
|
07 peugeot 2008 4,824 |
07 nissan juke 100,000 |
|
08 audi a3 100,000 |
08 mini 100,000 |
|
09 ford kuga 4,824 |
09 vauxhall mokka 100,000 |
|
10 volvo xc40 100,000 |
10 audi a3 4,824 |
October overview
| oct 23 | oct 22 | % change | |
|---|---|---|---|
|
pickups |
312 |
3,312 |
41.1% |
|
4x4s |
312 |
3,312 |
41.1% |
|
vans <=2.0t< /p> |
312 |
3,312 |
41.1% |
|
vans > 2.0 - 2.5t |
312 |
3,312 |
41.1% |
|
vans > 2.5 - 3.5t |
312 |
3,312 |
41.1% |
|
All vans to 3.5t |
312 |
3,312 |
41.1% |
|
rigids > 3.5 - 6.0t |
312 |
3,312 |
41.1% |
 SMMT Data shop
To purchase more detailed data visit the SMMT DataShop